Listen to Wikipedia. No really, it’s actually very cool.
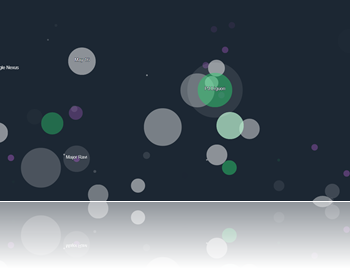
So over at http://blog.hatnote.com/post/56856315107/listen-to-wikipedia they are publishing a data representation tool that derives graphics and sound from real time activity on Wikipedia. It draws colored circles of various sizes and colors while also playing a sound that represents certain activity.
 Bells are subtractions while strings are additions.
Purple circles are bots while white circles are edits by registered users.
The blog post details what it all means. I really enjoy the randomness of it, it reminds me of rain.
I hope you enjoy it!
From the blog post:
Listen to Wikipedia was written by Stephen LaPorte and Mahmoud Hashemi, and is open-source. Like RCMap, L2W gets its real-time Wikipedia data as broadcast by Wikimon. L2W was inspired by and partially based on Listen to Bitcoin, but was mostly rebuilt to useD3.js (also like RCMap). We also use howler.js for cross-browser audio support, and additional sound processing was facilitated by SoX.